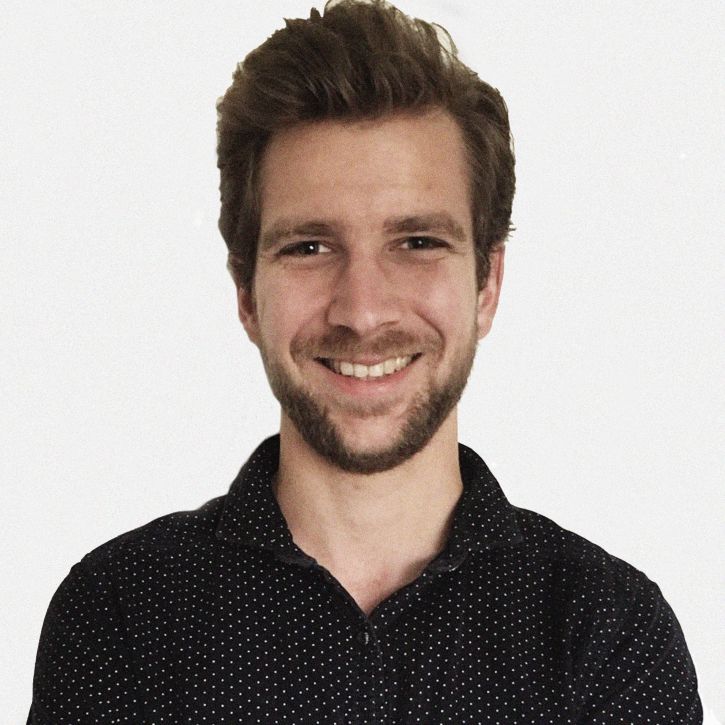
Curriculum Vitae
Personal Story
For me, the greatest thing about data is it’s universal language. Rows upon rows, columns besides columns. Meaningless on it’s own. Yet an absolute goldmine when combined with context and proper exploration. Where many people prefer being an expert in one field of work, I absolutely love the fact that data analysis is a thing in any field or sector. Getting to know one’s business in order to extract the true value of the data analysis is the most exciting part for me.
Besides my passion for data, I might even be more passionate about the outdoors. Climbing in the Scottish Highlands, hiking through the Belgium Ardennes, surfing on the Australian coastline or just sitting out on my balcony, moments to cherish and times to feel free.
So what’s missing here? Music of course! Festivals and concerts are my jam. Rock to Pop, Jazz to Rap, Country or R&B, I listen to all of it. Hopefully I’ll get around to analysing some amazing music datasets (Similar to my work at Appic, where I was a data analyst for a music festival app start-up).
If you ever see a guy surfing, hiking or climbing with a laptop and headphones.. That’ll be me.
Professional Projects
Besides the projects that you can find on this blog, I occasionally need to work for a living (strange right?). Below you can find a couple of example projects open to the public. FlexDashboard: Economische Verkenning Rotterdam 2018 (EVR)
Visualising & Dashboarding
Creating a handmade,shareable and reproducible dashboard for internal and external use in the corporate identity of the Rotterdam municipality. Written in R and R Markdown, using the JavaScript library Highcharts. The dashboard can be found here. Seperate graphs made by me can be found all over the EVR Website
Click here for a preview.
Shiny App: Real Estate Navigator
Visualising & Dashboarding & Application Building
Interactive leaflet map for the visualisation of real estate data and accompanying workforce related function within the municipality of Rotterdam. A selection on the map can be drawn, after which the entire dashboard will change it’s data accordingly. Multiple statistical analysis and visualisations are then given based on the selected region.
Educational Progress
Data Science & Business Analytics (VU | 2017 - 2018)
MSc Master Marketing & Management (Tilburg University | 2016 - 2017)
Stefan is a hard-working, innovative and pragmatic young professional. I’m amazed by his eagerness (and ability) to master SQL and R quickly. Stefan really embraces challenges rather than shy away from them. Mentoring Stefan was a great experience, and I am sure he will be a valuable asset to any data-driven company.
dr. Hannes Datta MSc | Professor at Tilburg University
BSc Bachelor Sports & Economy - Marketing & Management (Fontys | 2012 - 2015)
BSc Innovation Sciences (TU/E | 2011-2012)
BSc in Backpacking & Traveling (Australia | 2010-2011)
Pre-University Education (VWO) (D’oultremontcollege | 2004 - 2010)
Work Experience
- Rotterdam Municipality | Data Science Trainee (2017 - 2018)
- Appic | Data Analyst (2016-2017)
- Jos America | Marketing Communications Assistent(2012-2014)
- Various Hospitality Establishments | Bartender & Waiter (2008-2017)
Gradient Metrics | Marketing Data Scientist (2018 - Present)
Employed full-time as a remoteMarketing Data Scientist
Skills
Below you can find a radar chart with my skillsets. Click on one of the categories to drilldown to a subset of related skills and my, of course, extremely objective ratings.

